
See The data
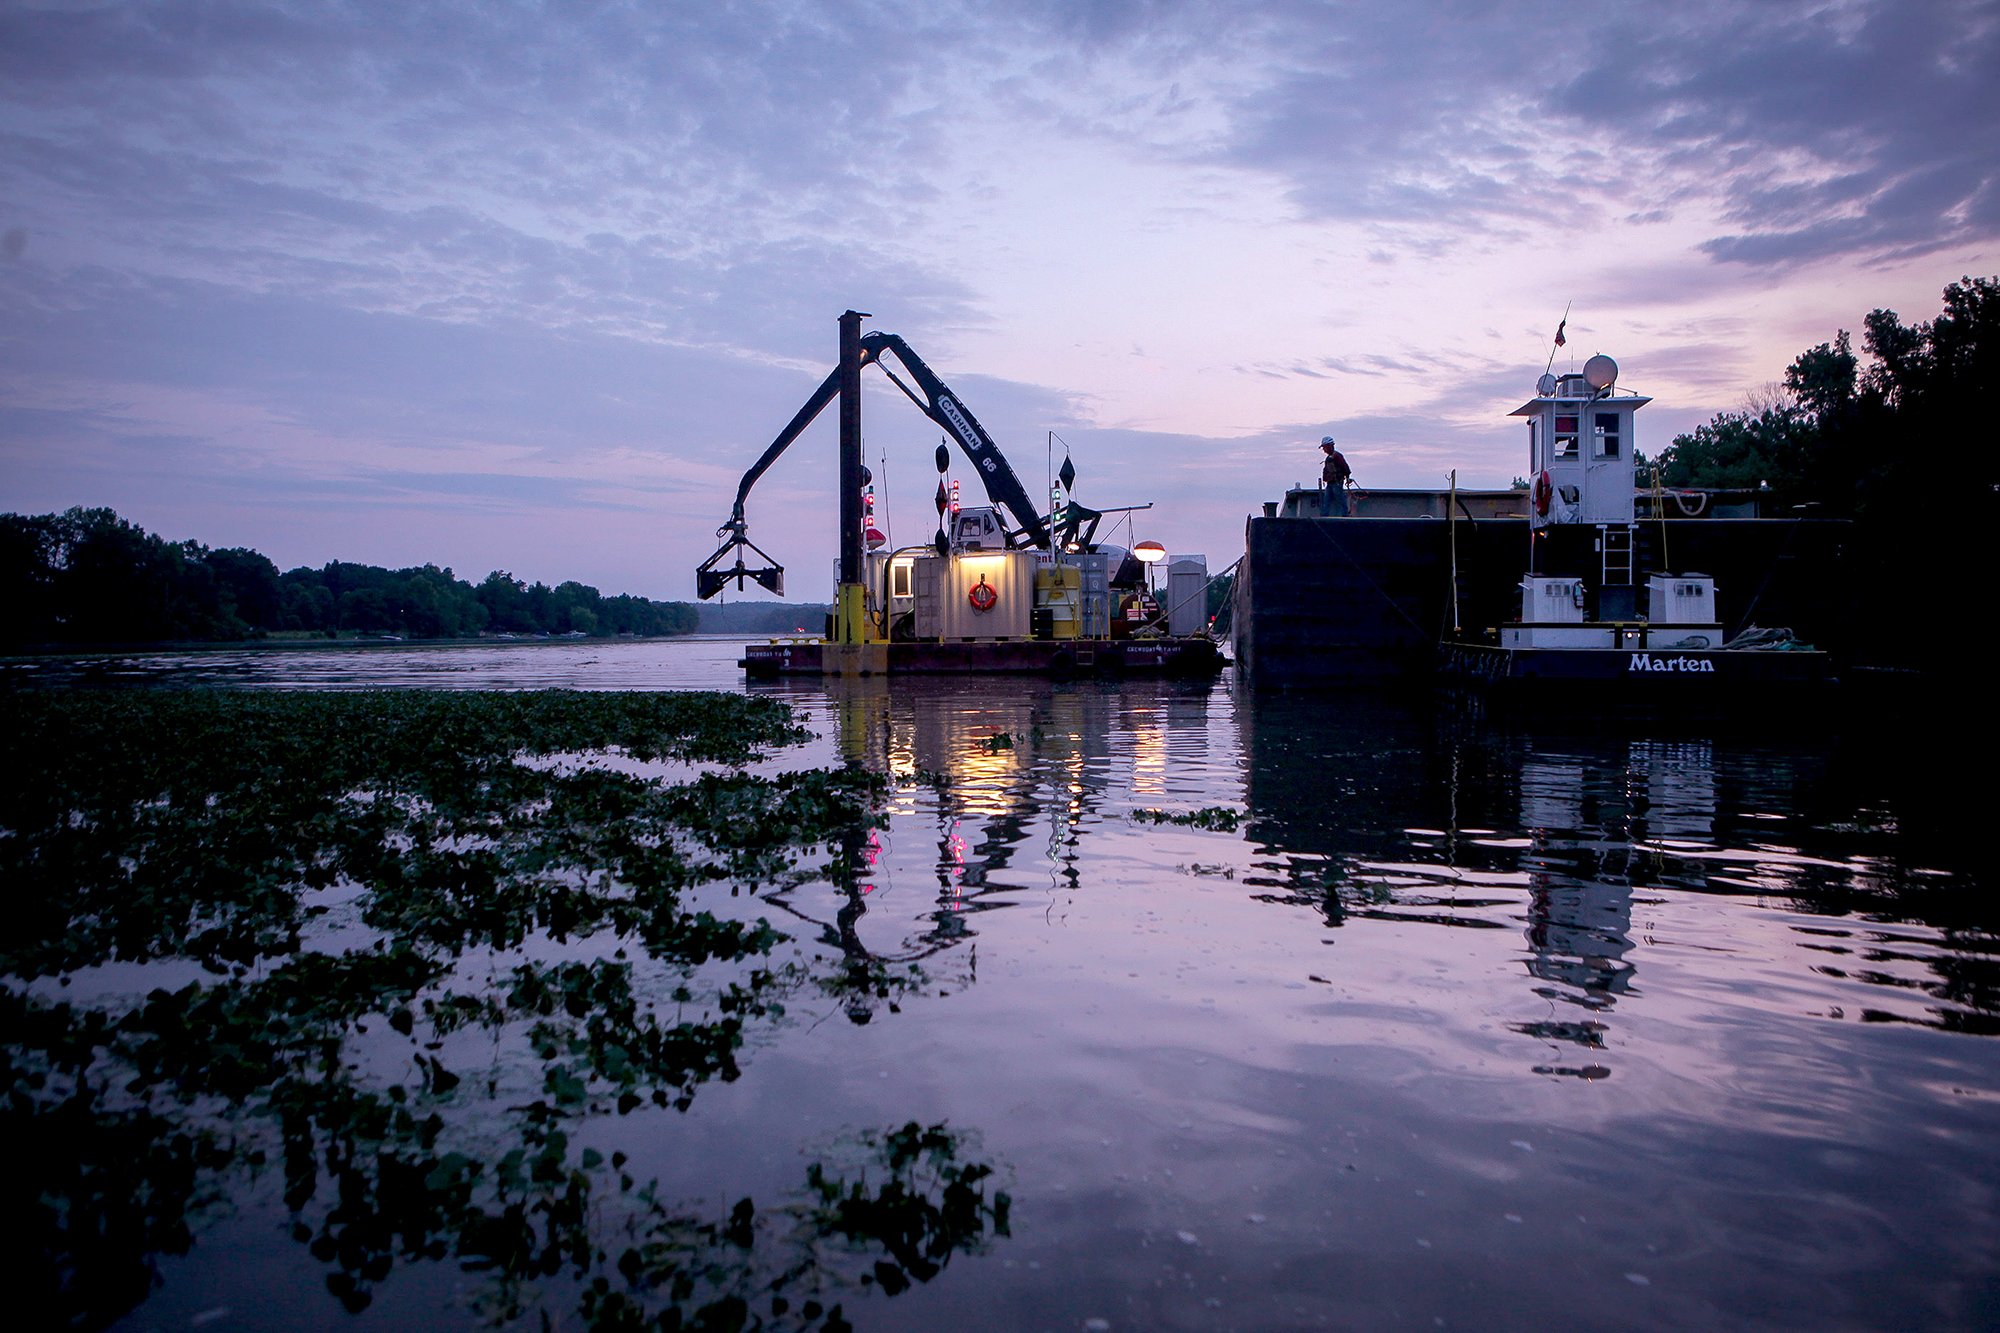
“The Hudson River PCB Superfund dredging project … is a historic achievement for the recovery of the Hudson River.”
PCB Levels in Sediment
down as much as 92%
PCB levels in sediment in the Upper Hudson River in 2021 were as much as 92% lower than the pre-dredging average.
99.9%
of sediment samples collected from the Upper Hudson River in 2021 had PCB levels below the dredging criteria established by EPA.

75%+
of the PCBs in the Upper Hudson were removed – twice the amount of PCBs as had originally been anticipated.
PCB levels in Water
down as much as 79%
PCB levels in Hudson River water are down as much as 79% at the five monitoring locations between Fort Edward and Poughkeepsie.

Water data collected from May through December when river flows at Thompson Island were equal to or below 5,000 cubic feet per second and at Albany during all river flows. Pre-dredging data collected in 2004-2008, and post-dredging data collected through 2022. All data analyzed by Anchor QEA.
Let’s take a closer look …
The charts below show the levels of Tri+ PCBs in the water at Schuylerville and Waterford during July, August and September. Tri+ PCBs are measured because they are the type of PCBs taken up by fish. The summer months were chosen because PCB levels in water are typically at their highest point of the year in the summer due to biological activity in the sediments.
PCB levels in water at Schuylerville continue to drop.

Tri+ PCBs levels in water during the summer at Waterford also continue to drop. This is particularly noteworthy because this represents PCBs that might otherwise flow into the Lower Hudson River.

Understanding the Data: Total vs. Tri+ PCBs
A PCB is a compound that has up to 10 chlorine atoms bonded to a “base” compound of carbons. Fish take up PCBs that have three or more chlorines (“Tri+ PCBs”). The Upper Hudson River sampling program looks at both total PCB levels in water, as well as Tri+ PCB levels in order to see what is available to fish.
65% Post-dredging
91% Decline Since 1990,
PCB levels in Upper Hudson FISH
PCB levels in Upper Hudson River sportfish, as weighted by species and river section, have dropped by 91% when comparing average levels from the 1990s to those levels observed in the fish collected in 2022. These declines are a result of GE’s work to reduce the PCBs entering the river from the company’s former plant sites in Hudson Falls and Fort Edward, the massive dredging project that occurred from 2009 to 2015, and natural recovery.
Since dredging has been completed, PCB levels in Upper Hudson sportfish have declined 65%, comparing a five-year average prior to dredging (2004-2008) to a three-year post-dredging average (2020-2022).
These data are presented in the charts below.


PCB levels in the Lower Hudson in striped bass are significantly lower than before dredging.


Data sources: Anchor QEA, New York State Department of Environmental Conservation.