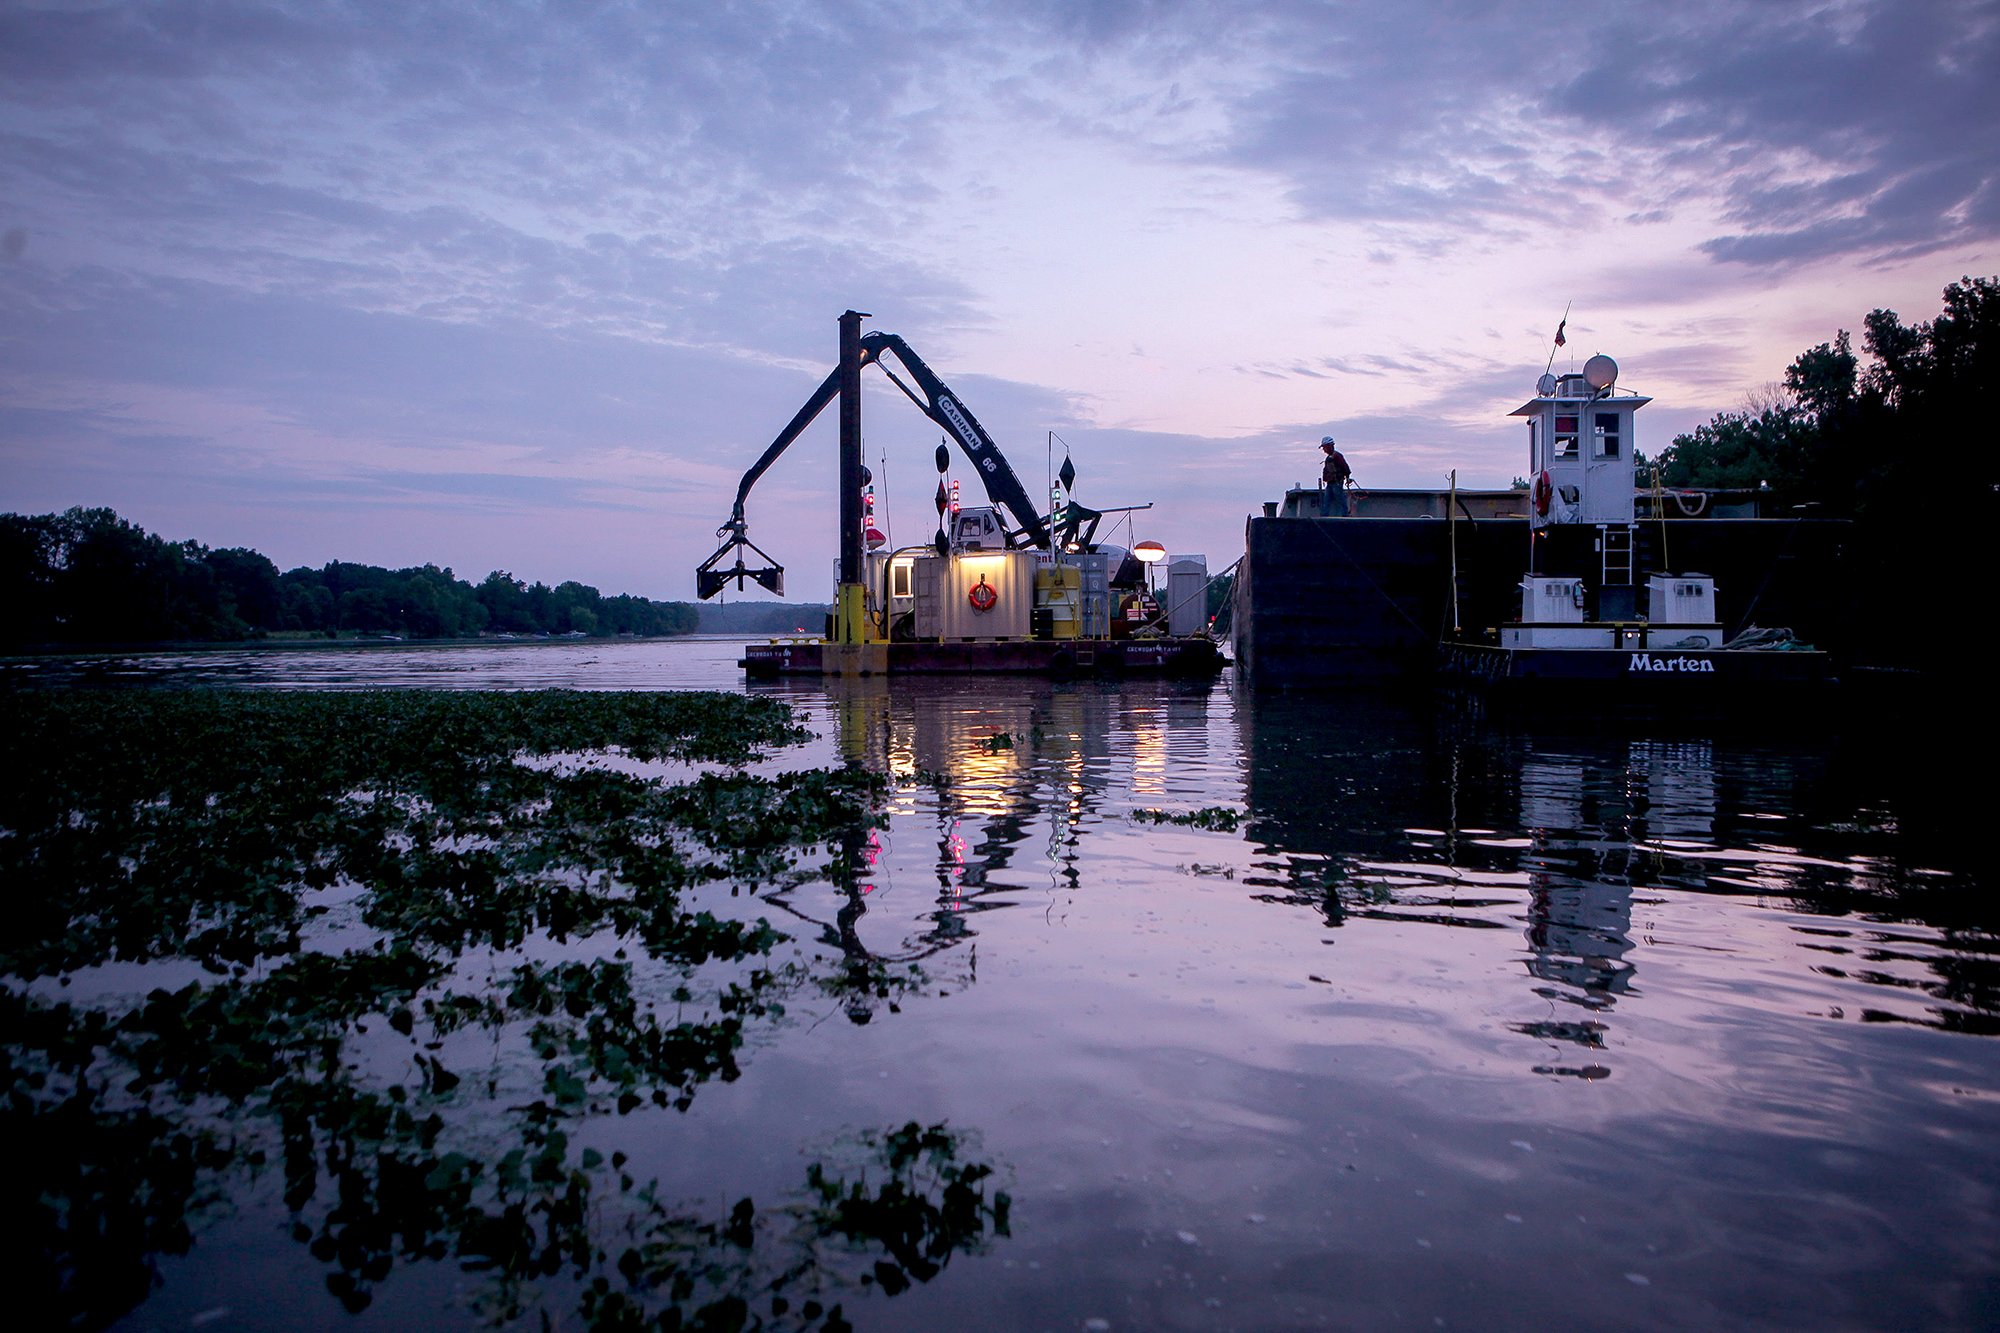
water data
PCB levels in Water
down as much as 79%
PCB levels in Hudson River water are down as much as 79% at the five monitoring locations between Fort Edward and Poughkeepsie.
Source: GE Data, gathered with USEPA oversight.
Let’s take a closer look …
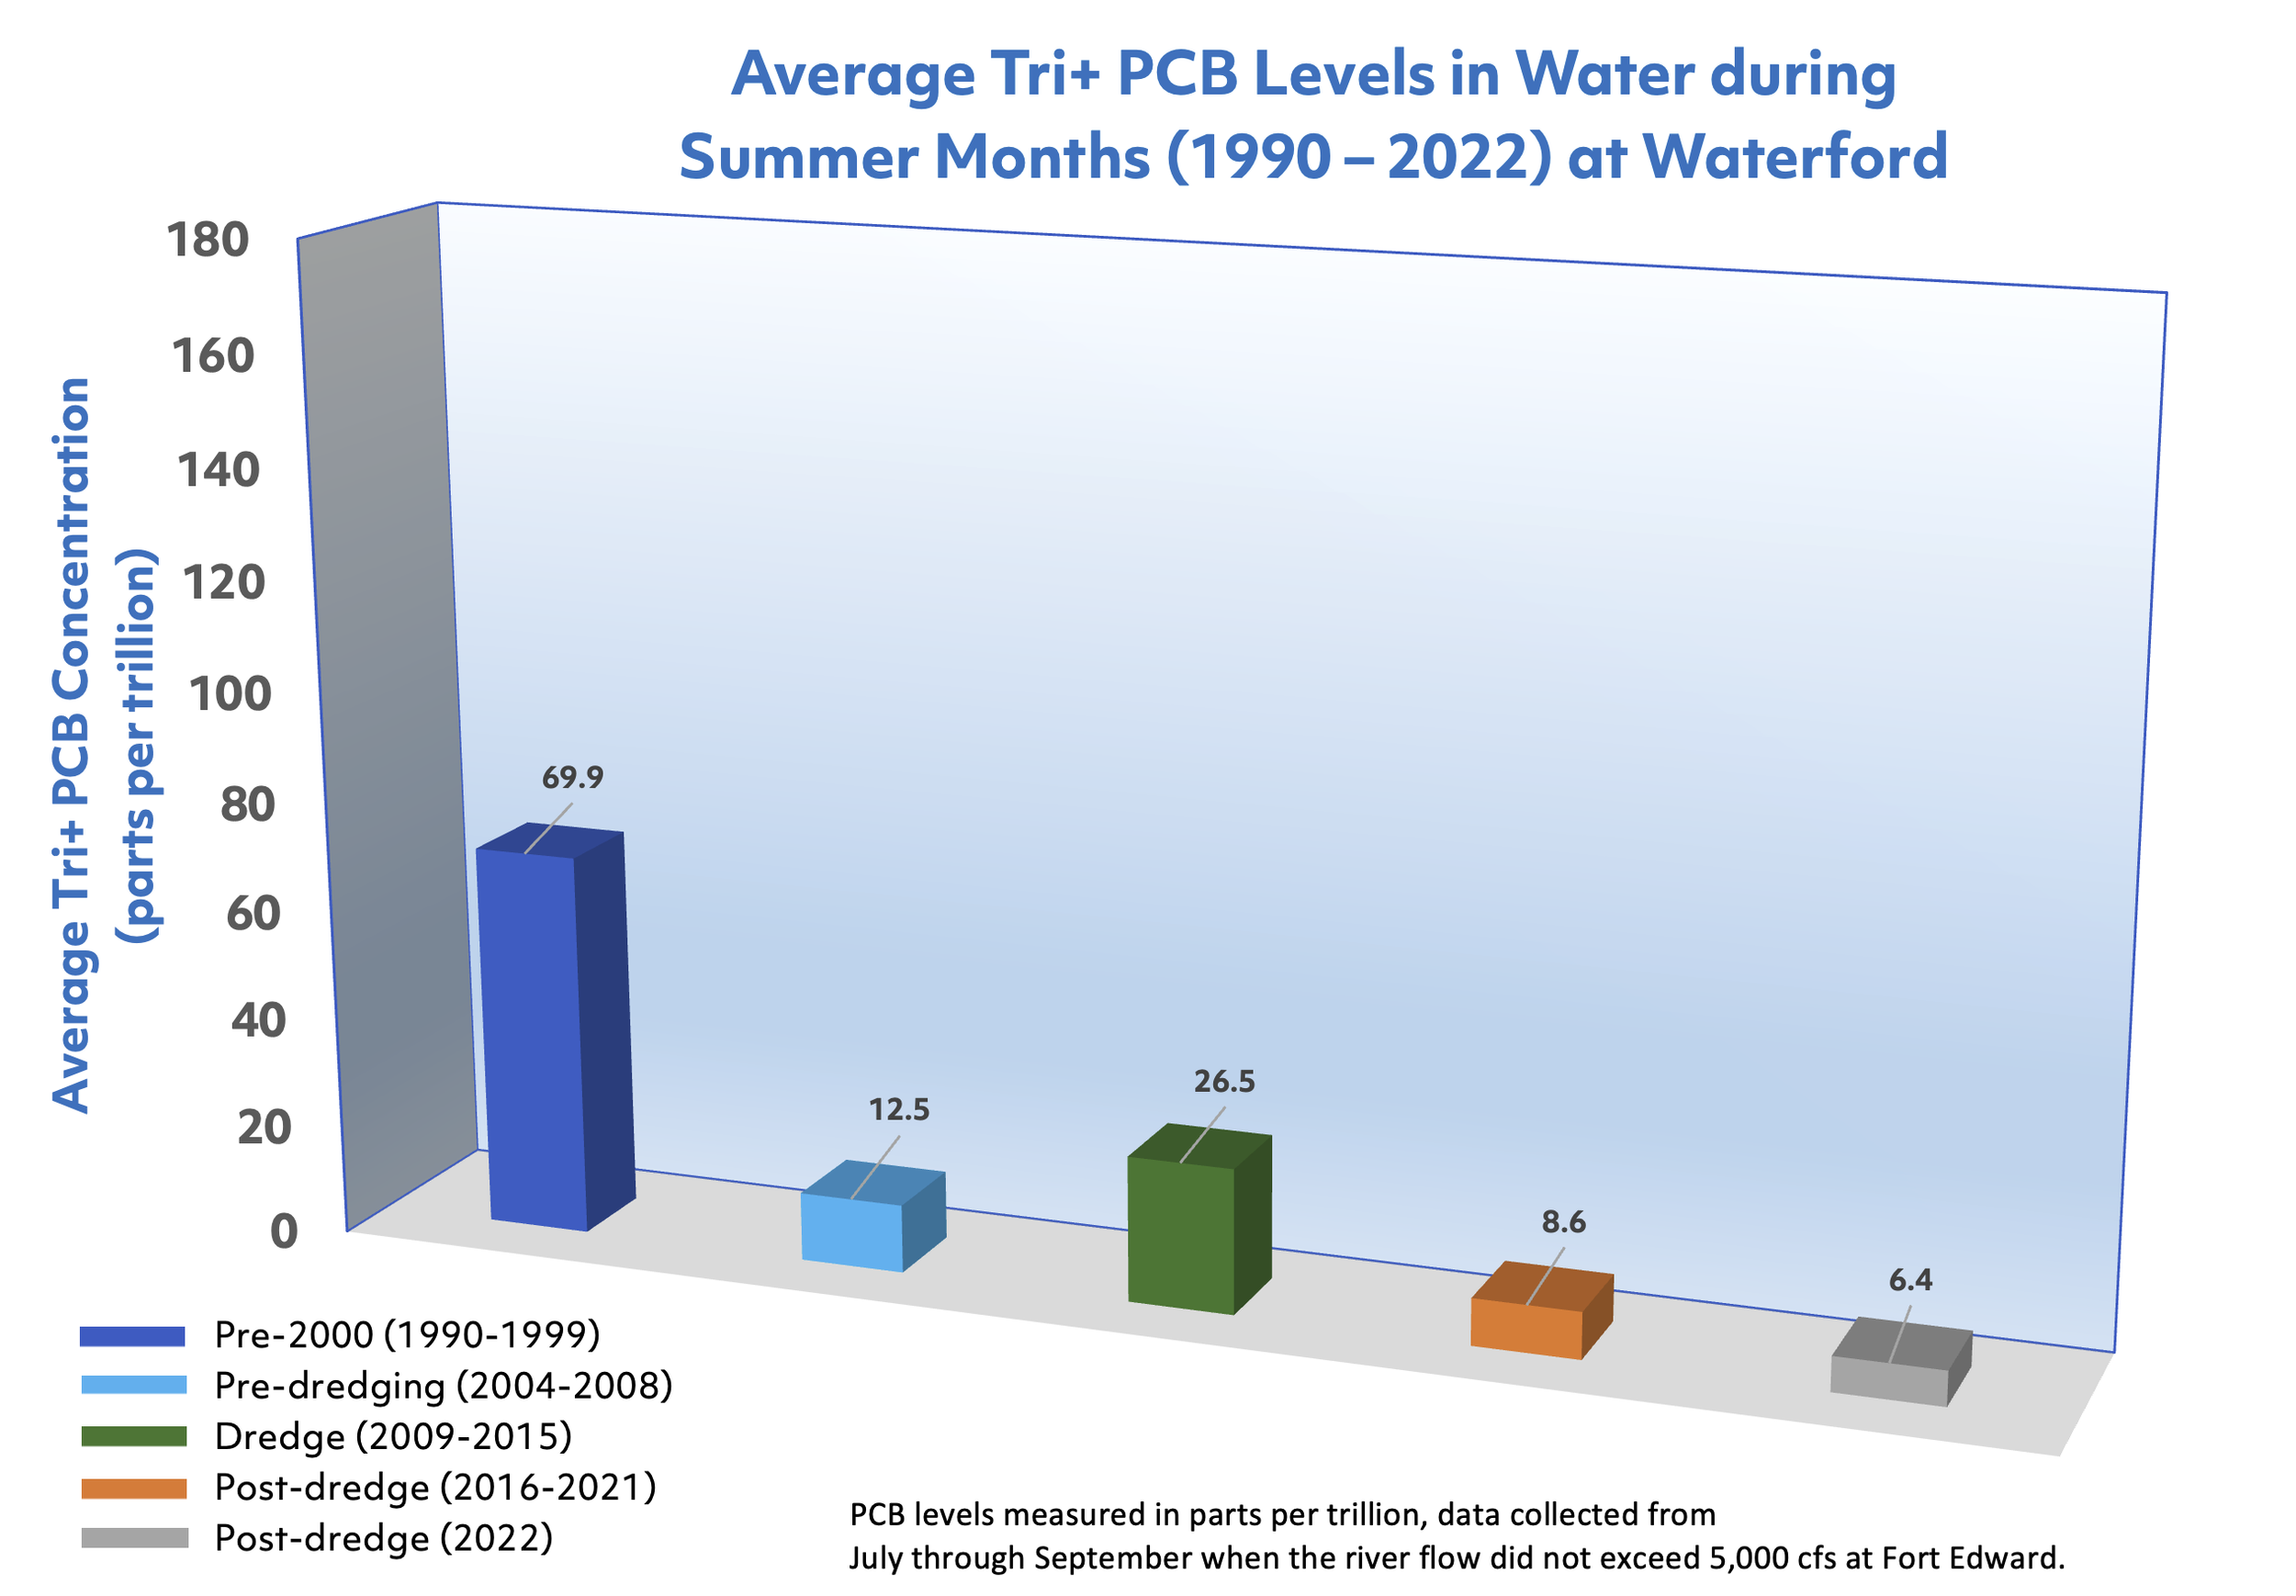
The charts below show the levels of Tri+ PCBs in the water at Schuylerville and Waterford during July, August and September. Tri+ PCBs are measured because they are the type of PCBs taken up by fish. The summer months were chosen because PCB levels in water are typically at their highest point of the year in the summer due to biological activity in the sediments.
Tri+ PCB levels in water at Schuylerville continue to drop.
Source: GE Data, gathered with USEPA oversight.
Tri+ PCB levels in water during the summer at Waterford also continue to drop. This is particularly noteworthy because this represents PCBs that might otherwise flow into the Lower Hudson River.
Source: GE Data, gathered with USEPA oversight.
Understanding the Data: Total vs. Tri+ PCBs
A PCB is a compound that has up to 10 chlorine atoms bonded to a “base” compound of carbons. Fish take up PCBs that have three or more chlorines (“Tri+ PCBs”). The Upper Hudson River sampling program looks at both total PCB levels in water, as well as Tri+ PCB levels in order to see what is available to fish.


